Data-Driven Decisions, Not Gut Feelings
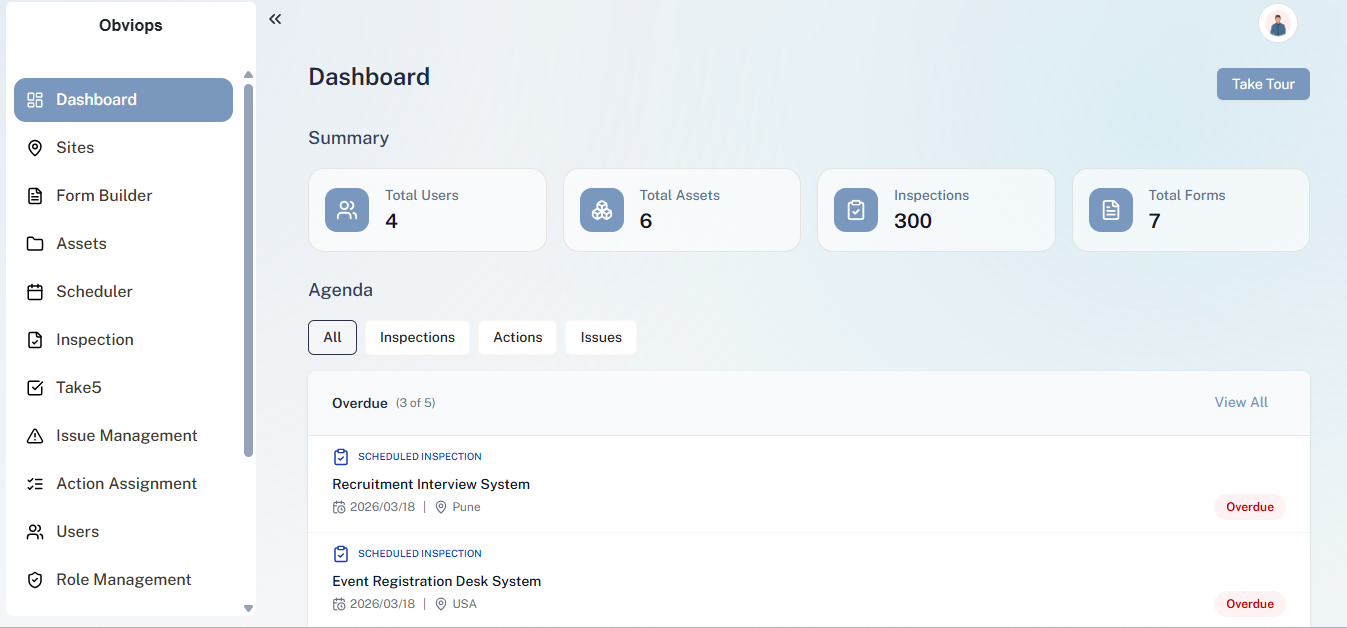
Live dashboards and automated reports that surface what matters compliance rates, recurring failures, team performance, and cost trends all from a single source of truth.
What's included
Key Capabilities
Live Operational Dashboards
Role-based dashboards for executives, site managers, and technicians each seeing exactly what they need.
Failure Trend Analysis
Identify the top recurring failure modes across assets, sites, and time periods to target root causes.
Compliance Rate Tracking
Real-time inspection compliance by site, team, asset class, and date range with drill-down capability.
Simple by design
How Modules Work Together
Data flows in automatically
Every inspection completed, work order closed, or asset updated feeds the analytics engine in real time.
Pick your metrics
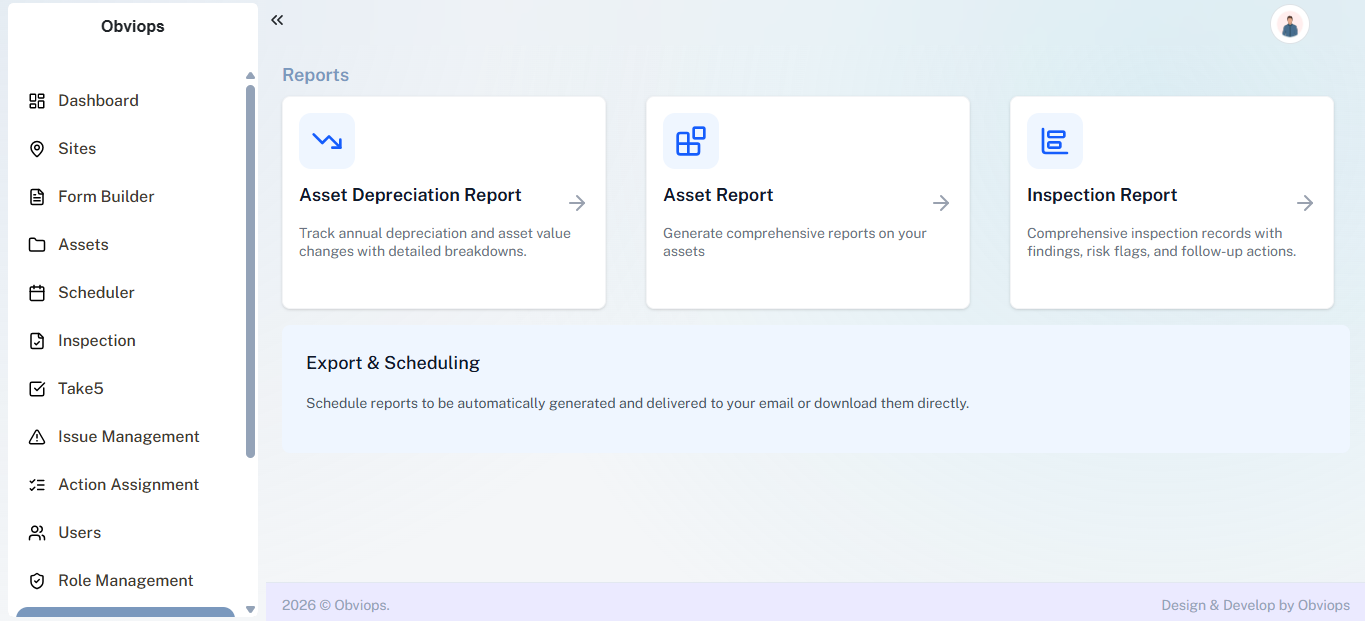
Analyze prediction outcomes and trends through visual insights to support better decision-making.
Share insights with stakeholders
Easily share detailed reports and insights with clients and stakeholders in just a few clicks.
Turn operations data into competitive advantage
Book a demo to see your industry's standard KPIs pre-configured and ready to go from day one.
Book a Free Demo